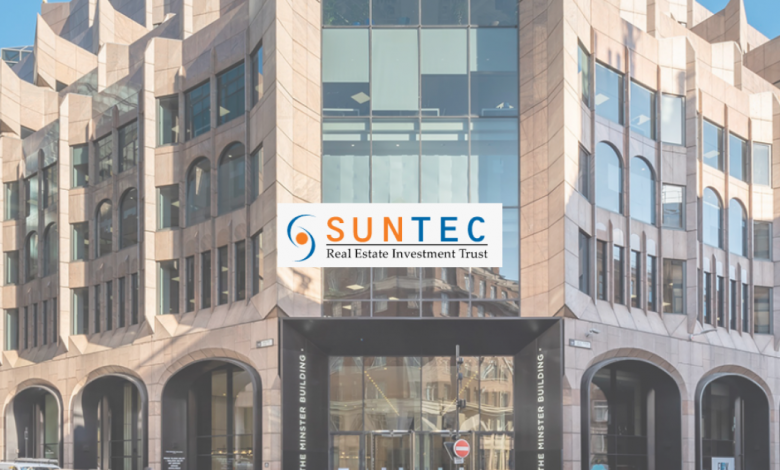
Suntec REIT is a Singapore listed REIT with properties presence across Singapore, Australia and the United Kingdom. They invest mainly in the office and retail sector either wholly or partially. As of 31 December 2021, here is a breakdown of Suntec REIT portfolio and ownership.
| Properties | Ownership |
| Singapore Properties: | |
| Suntec City Mall | |
| – Suntec City Office | 59.00% |
| – Suntec City Retail | 100.00% |
| – Suntec Singapore Convention and Exhibition Centre | 66.30% |
| One Raffles Quay | 33.30% |
| Marina Bay Financial Centre | 33.30% |
| Australia Properties: | |
| 177 Pacific Highway, Sydney | 100.00% |
| Southgate Complex, Melbourne | 50.00% |
| Olderfleet, 477 Collins Street, Melbourne | 50.00% |
| 55 Currie Street, Adelaide | 100.00% |
| 21 Harris Street | 100.00% |
| United Kingdom Properties: | |
| Nova Properties | 50.00% |
| Minster Building | 100.00% |
In FY21 itself, COVID-19 remain uncertain with various measures remain in place. Hybrid working remain a key drivers in business impacting the office sector. With that, let’s dive into Suntec REIT FY21 performance to see how it has performed.
Read More:
- 7 Key Things To Know Of Suntec REIT FY20 Performance
- 9 Key Things You Need to Know About Suntec REIT Performance
1. Overall occupancy rate improved slightly in FY21
| Commited Occupancy | 31-Dec-19 | 31-Dec-20 | 31-Dec-21 |
| Suntec City Office | 100% | 96% | 97% |
| One Raffles Quay | 98% | 97% | 99% |
| MBFC Towers 1 & 2 | 99% | 98% | 97% |
| 9 Penang Road | 97% | 100% | – |
| Singapore Office Portfolio | 99% | 97% | 98% |
| 177 Pacific Highway | 100% | 100% | 94% |
| Southgate Complex | 100% | 100% | 92% |
| 55 Currie Street | 92% | 92% | 96% |
| 21 Harris Street | – | 69% | 91% |
| 477 Collins | – | 97% | 98% |
| Australia Office Portfolio | 98% | 94% | 94% |
| Nova Properties | – | 100% | 100% |
| Minster Building | – | – | 97% |
| United Kingdom Office Portfolio | 98% | 100% | 98% |
Retail and office sector is one of the few sector that is adversely impacted by Covid-19 pandemic. With easening measures gradually introduced, it is interesting to see how Suntec REIT has performed operationally. Its overall office occupancy rate has remained fairly stable with its Singapore office portfolio hovering above 97% while Australia office portfolio hovering above 90%.
During the year itself, they have divested 9 Penang Road in Singapore and added Mister Building in June 2021 into their United Kingdom Office Portfolio.
| Committed Occupancy | 31-Dec-19 | 31-Dec-20 | 31-Dec-21 |
| Suntec City Mall | 100% | 90% | 95% |
| Marina Bay Link Mall | 98% | 92% | 92% |
| Singapore Retail Portfolio | 100% | 90% | 95% |
| Southgate Complex | 93% | 92% | 86% |
| Australia Retail Portfolio | 93% | 92% | 86% |
As for their retail portfolio, there has been a mixed performance. Singapore retail portfolio has improved from 90% in FY20 to 95% in FY21 driven by improvement in Suntec City Mall. Australia retail portfolio on the other hand reported a decline contributed by Southgate Complex where its occupancy rate declined from 92% in FY20 to 86% in FY21.
2. Overall increase in financial performance
| SGD in mn | FY19 | FY20 | FY21 |
| Revenue | 367 | 315 | 358 |
| Net Property Income | 236 | 200 | 255 |
FY20 has been a fairly bad year for Suntec REIT being adversely impacted by the COVID-19 pandemic. In FY21, its financial performance has improved. Revenue grown from SGD 315 mn in FY20 to SGD 358 mn in FY21 while net property income grew from SGD 200 mn in FY20 to SGD 255 mn in FY21. The improvement is driven by
- New acquisition of Minster Building acquired in June 2021
- Increased contributions from 477 Collins Street and 21 Harris Street
- Lesser rent assistance at Suntec City Mall
- One-off surrender fee received at 177 Pacific Highway
3. Distribution per unit rebound in FY21
| SGD in cents | FY19 | FY20 | FY21 |
| Distribution per unit | 9.5 | 7.4 | 8.7 |
Similar to the reported financial performance, its distribution per unit has declined in FY20 as a result of the COVID-19 pandemic. FY21 has been a turnaround year for Suntec REIT with distribution per unit growing from 7.4 cents in FY20 to 8.7 cents in FY21. This growth is driven by the new contributions from Nova Properties and The Minster Building, higher contribution from Australia assets and a higher retail income at Suntec City Mall.
Based on the closing traded price, this would give investors a yield of 5.8%.
Read More: Why you should never buy a REIT just because they have a high dividend yield
4. Stable debt profile

As at 31 December 2021, Suntect REIT has a total borrowings of SGD 4.9 billion which translates a leverage ratio of 43.7%, a slight decline from 44.3% in the preceding year. This is slightly below the permissible limit giving them a slight debt headroom for asset acquisition and enhancement initiatives.
Of the total borrowings, approximately 53% of its debt are fixed. This would give them a balance ratio of certainty and interest rate risk. Due to the low interest rate environment, Suntec REIT has reported a slight decline in all in financing cost from 2.53% p.a in FY20 to 2.35% p.a in FY21.
Summary
Based on our analysis, Suntec REIT has rebounded slightly from the COVID-19 pandemic both financially and operationally. The acquisition of The Minster Building has been a key driver of performance in FY21. Based on the closing NAV and traded price as at 31 December 2021, this would translate to a price to book ratio of 0.72.
What are your thoughts on Suntec REIT FY21 performance? If you are just getting started, feel free to read more of our REIT Guide and REIT Analysis. You can also read more about what REITs are if you are new to REITs.
Want to get fresh out of the oven updates? Join our telegram channel.


