CapitaLand China Trust (CLCT) or previously known as CapitaLand Retail China Trust (CRCT) is Singapore’s largest China-focused REIT. Since our last post on CLCT, there have been a number of developments and with the release of the recent FY20 annual report, we have decided to deep dive to better understand how CLCT has performed.
In the interest of new readers, allow us to briefly introduced CLCT. CLCT was listed in the Singapore Exchange back in 8 December 2006. To date, CLCT’s portfolio constitutes 13 shopping malls and 5 business parks spanning across 11 cities. CLCT is managed by CapitaLand China Trust Management Limited, which is a wholly owned subsidiary of Singapore-listed CapitaLand Limited, one of Asia’s largest diversified real estate groups. This would allow CLCT to leverage on the extensive CapitaLand extensive real estate experience.
Now that we briefly know about CLCT, let’s dive into its FY20 performance to see how it has performed.
1) Renamed CapitaLand China Retail Trust (CRCT) to CapitaLand China Trust (CLCT)
The first thing anyone would have noticed is the change of CRCT name to CapitaLand China Trust effective 26 January 2021. This is in line with the investment mandate change as announced last September 2020. With the change in mandate, CLCT portfolio coverage would expand from purely retail to a wider class of assets such as industrial assets, business park and etc. Hence, the change in name to reflect the following.
2) Completed acquisition of 6 assets in FY20 and 2021
In Q4 2020, CLCT has announced its plan to further expand its overall portfolio with the acquisition five business parks and the balance 49% interest in Rock Square. This would be for an c.SGD 1 billion which is CLCT largest acquisition to date. These acquisition is no doubt a plus in the diversification of CLCT assets from purely retail.
- Ascendas Xinsu Portfolio
- Ascendas Innovation Towers
- Remaining 49% interest in Rock Square (Retail)
- Ascendas Innovation Hub
- Singapore-Hangzhou Science Technology Phase I
- Singapore-Hangzhou Science Technology Phase II
With the exception of Rock Square of which acquisition is completed in FY20, the acquisition of the remaining 5 assets were completed in 2021. The acquisition of Singapore Hangzhou Science Technology Phase I & II is completed on 18 June 2021, and with that, all these properties have been fully acquired. As at 31 March 2021, the business park portfolio enjoys a healthy occupancy rate of 92.1%.
3) Slight decline in overall occupancy rate with a positive outlook

Looking at CLCT overall occupancy rate, we noticed a slight drop from 96.7% in FY19 to 94.1% in FY20. This comes to no surprise given the COVID-19 outbreak impacting business globally. CLCT assets which are predominantly in the retail sector are without a doubt a sector which were heavily impacted. However, if we were to take a step back, the economy especially in China has picked up since. From the recent release of CLCT Q1 2021, the shopper traffic in Q1 2021 has increased by 52.1% when compared to Q1 2020. This is an overall positive sign.
Not only that, the expansion of additional 5 business parks assets would be a great aspect to lookout for. Another positive spect would be the divestment of CapitaMall Minzhongleyuan which has been on a consistent decline. In our opinion, the additional capital from divestment can be better redeployed.
4) Decline in financial performance from the impact of COVID-19
| SGD in mil | FY17 | FY18 | FY19 | FY20 |
| Gross Revenue | 229.2 | 239.9 | 259.2 | 228.7 |
| Net Property Income | 149.2 | 159.3 | 180.1 | 148.3 |
Revenue has declined from SGD 259.2 mil in FY19 to SGD 228.7 mil in FY20 whereas net property income has declined from SGD 180.1 mil in FY19 to SGD 148.3 mil in FY20. This decline is in line with the overall drop in occupancy rate. Nevertheless, with the gradual economic recovery, we would expect the performance to further improve.
Furthermore, the 5 newly added business parks which was fully acquired in 2021 will further grow CLCT overall financials performance.
5) Distribution per unit dropped in line with the financial performance
| Cents | FY17 | FY18 | FY19 | FY20 |
| Distribution per unit (DPU) | 10.10 | 10.22 | 9.9 | 6.35 |
CLCT’s distribution per unit on the other hand has declined from 9.99 cents to 6.35 cents which is in line with its overall operational and financial performance. Based on its 31-December 2020 closing price of SGD 1.39, this would give investors a yield of 4.6%.
6) Overall healthy gearing level
| % | FY17 | FY18 | FY19 | FY20 |
| Leverage | 28.4% | 35.4% | 36.7% | 31.8% |
From CLCT debt perspective, its gearing has declined from 36.7% in FY19 to 31.8% in FY20. This is a fairly healthy level and is way below its permissible limit giving them ample debt headroom for further asset enhancement and acquisition initiatives.
7) Heathy tenant concentration profile

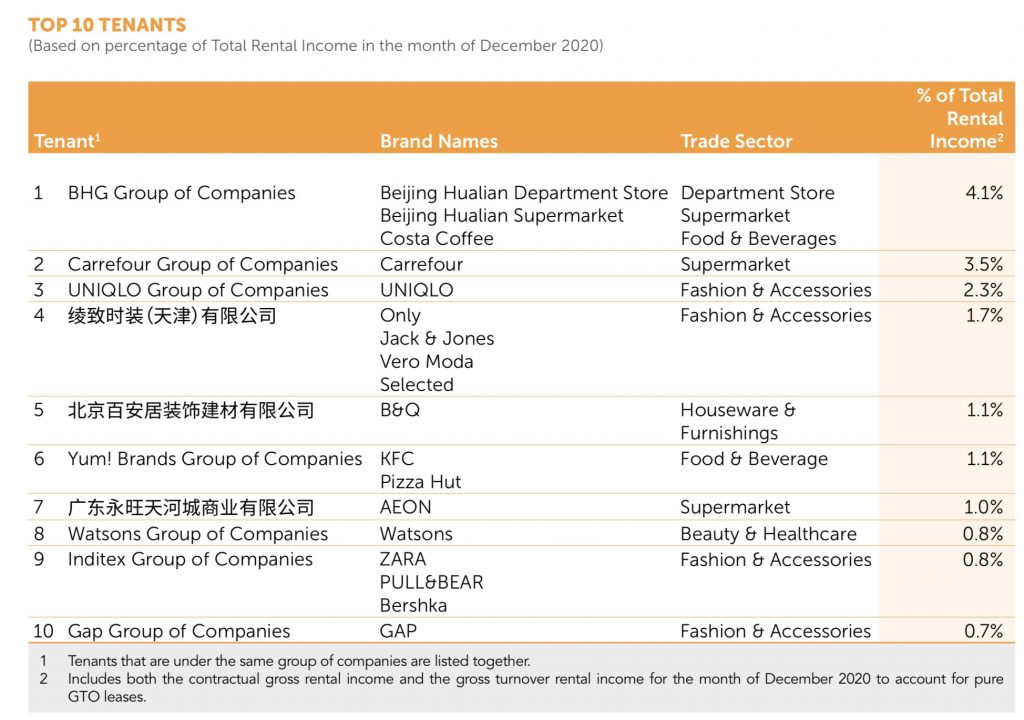
The final aspect we would like to highlight on CLCT is on its overall tenant concentration. This is a positive point. If we were to look at its top 10 tenants, there is no single tenants that contribute more than 5% of CLCT total rental income. The biggest contributor is BHG Group of companies which accounts for 4.1% of the total. This is no doubt a healthy tenant concentration profile.
Summary
From REIT Pulse analysis, CLCT performance in FY20 has no doubt been impacted by COVID-19. In fact, most REITs are impacted one way or another. However, we see growth opportunities in CLCT performance given the gradual economic recovery and the expected contribution from its newly acquired properties.
What are your thoughts on CapitaLand China Trust? If you are just getting started, feel free to read more of our REIT Guide and REIT Analysis. You can also read more about what REITs are if you are new to REITs.
Do join our community over at Facebook and Instagram.


