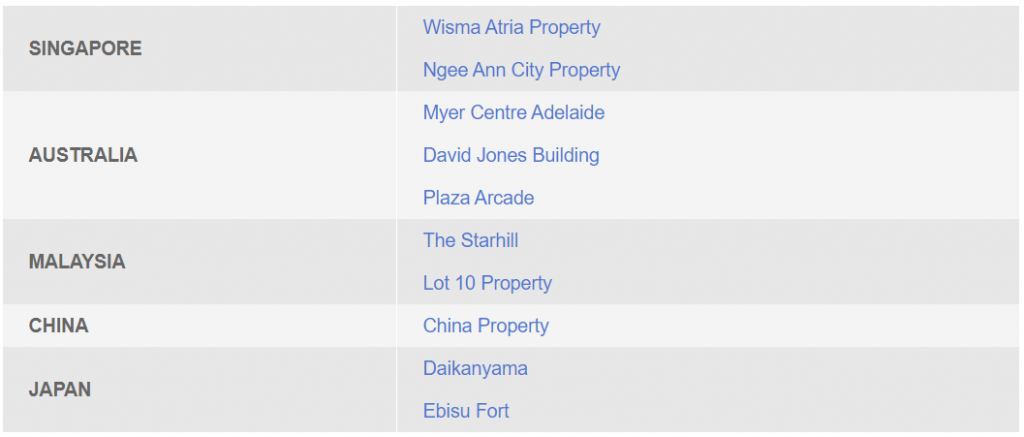
Starhill Global REIT is a Singapore-based REIT listed in September 2005. Their assets are predominantly in the office and retail sector with a presence in Singapore and overseas. Since their listing in the Singapore Exchange, they have grown their portfolio from two properties in Singapore to 10 properties across Singapore, Australia, Malaysia, China and Japan.

They are managed by YTL Starhill Global REIT Management Limited which is indirectly held by YTL Corporation Berhad. In this post, we will look at how Starhill Global REIT has performed historically and 1H21.
1) Singapore account for approximately 70% of its overall portfolio
| % by asset Value | |
| Singapore | 69% |
| Australia | 14% |
| Malaysia | 14% |
| Others (China and Japan) | 3% |
| Total | 100% |
Starhill Global REIT owns 10 properties across 5 different geographical regions. However, its Singapore assets account for c.69% of the overall portfolio. These comprise of both Wisma Atria and Ngee Ann City. This would mean that Starhill Global REIT is heavily reliant on these two properties. The remaining 8 properties only account for 21% cumulatively.
Depending on how you view it, the huge concentration on these two properties could potentially be bad to Starhill Global REIT if there in the event of any adverse event.
2) Stable Occupancy Rate
| FY18 | FY19 | FY20 | 1H21 (31-Dec-20) | |
| Singapore | 96% | 97% | 95% | 94% |
| Australia | 89% | 93% | 94% | 95% |
| Malaysia | 100% | 100% | 100% | 100% |
| China | 100% | 100% | 100% | 100% |
| Japan | 100% | 100% | 100% | 100% |
| Average Occupancy | 94% | 96% | 96% | 96% |
In terms of its overall occupancy rate, Starhill Global REIT has a fairly stable occupancy rate throughout the years. Its occupancy rate has always been at the 94% to 96% range since FY18. One commendable area is the 100% consistent occupancy in the Malaysia, China and Japan market.
Similarly, its Australia properties have been performing well too with a year on year growing occupancy from 89% in FY18 to 95% in Dec 2020. This is as a result of the improvement of businesses with sales achieving its Pre-COVID-19 levels in 1H21.
Singapore assets on the other hand dropped slightly in both FY20 and 1H21 due to the uncertainty of COVID-19. But nevertheless, most of its tenants were open for business in 1H21 with improvement in sales and traffic.
3) High Tenant Concentration with the top 10 tenants contributing to 58.8% of the gross rents

An aspect worth pointing out is the huge tenant concentration over at Ngee Ann City Property. Both Toshin Development Singapore and YTL Group cumulatively account for 37.6% of the gross rents. The negative aspect of this is that a loss in these two key tenants would be hugely detrimental to Starhill Global REIT.
However, looking at the bright side of things, YTL Group which account for 15.4% of the rent is a sponsor of Starhill Global REIT. Space which they occupied in The Starhill & Lot 10 Property have long tenures of approximately 19.5 years and 9 years commencing 2019.
4) Decreased in Financial Performance from FY18 to 1H21
| SGD in 000s | FY18 | FY19 | FY20 | 1H21 (6M) | 12M21 (Extrapolate) |
| Revenue | 208,814 | 206,190 | 180,773 | 88,420 | 176,840 |
| Net Property Income | 162,187 | 159,406 | 132,116 | 64,986 | 129,972 |
Looking at its financial performance, it has been on a year on year decline since FY18. Its revenue has dropped from SGD 208.8 mil in FY18 down to SGD 180.8 mil in FY20. The decrease in FY19 from FY18 was mainly due to lower contributions from Wisma Atria and the depreciation of AUD against SGD in respect to their Australia portfolio.
As for the drop from FY19 to FY20, it was mainly due to the rental assistance provided to eligible tenants due to the uncertainty of COVID-19. In addition to that, lower contributions from Starhill Gallery in relation to its asset enhancement and the depreciation of AUD against SGD in respect to their Australia portfolio also adds to the overall drop.
In 1H21, Starhill Global REIT reported revenue of SGD 88.4 million. Post extrapolation, this is still a decline from SGD 180.8 mil in FY20 to SGD 176.8 mil in 12M21E.
5) Year on Year Decline in Distribution Per Unit
| Cents | FY18 | FY19 | FY20 | 1H21 (6M) |
| Distribution Per Unit | 4.55 | 4.48 | 2.96 | 1.88 |
Distribution per unit of Starhill Global REIT has been on a year on year decline from 4.55 cents in FY18 to 2.96 cents in FY20. This is fairly consistent with its declining financial performance. On its recent 1H21 report, they have announced a 1.88 cents distribution per unit for the 1st half of FY21.
6) Gearing at a fairly healthy level

Last but not least, we will look into its debt profile. As at 31 December 2020, Starhill Global REIT has a total debt of SGD 1.12 billion debts. This translate to a gearing level of 35.8% which is fairly healthy. This is still within the permissible limit of 50% which would give them ample debt headroom for further asset enhancement and acquisition initiatives.
92% of its debt are fixed-rate in nature. This would reduce their overall interest rate risk.
Summary
Based on our analysis, Starhill Global REIT no doubt owns a number of key properties which is well known to many in Singapore. However, its financial performance and distribution per unit have been declining year on year. An area we are particularly concern about is the huge concentration on the Singapore assets as well as the overall tenant concentration.
The positive aspect on the other hand is the gradual recovery of the economy with the roll-out of vaccines. With this, we would expect the performance to begin picking up in the coming quarters.
What are your thoughts on Starhill Global REIT? If you are just getting started, feel free to read more of our REIT Guide and REIT Analysis. You can also read more about what REITs are if you are new to REITs.
Do join our community over at Facebook and Instagram.


